DPBuddy 3.4 can greatly facilitate collection and analysis of DataPower logs via its tight integration with the popular Elastic stack (Elasticsearch, Kibana, Beats and Logstash). DPBuddy provides several plugins for Logstash (Elastic’s log ingestion and transformation tool) that make DataPower log collection really easy.
Logs can be sourced in several different ways – via periodic log file download from DataPower (“pull approach”) or, in a more traditional way, using syslog or HTTP (SOAP/XML) log targets in DataPower. With the latter approach, Logstash is configured to listen to syslog or XML over HTTP events and DataPower pushes log events to the Logstash server.
You can find more information in our documentation.
Logstash is extremely flexible, it supports many different transformations and outputs. Most commonly, the log events will be saved in Elasticsearch, but many other output types are supported as well.
DPBuddy’s plugins obviate the need to use regular expressions to parse DataPower log messages. DataPower text log format is fairly complicated so DPBuddy saves a lot time. DPBuddy extracts several key fields from text/syslog or XML messages that can later be used in queries and analytics/dashboards in Elasticsearch and Kibana. Some of the fields include:
The plugins can also augment log events with the properties from dpbuddy.conf, such as environment name, application name, and others.
Information from DataPower logs can be combined with the DPBuddy’s audit log. DPBuddy uses consistent field names for DataPower logs and the audit log. This makes it easy to combine operational analytics with the history of configuration changes thus simplifying root cause analysis.
Of course, Elastic stack can be used for storing logs from many different sources (e.g., via its filebeat log shipper), not just DataPower logs. This allows for correlating log events and for log analytics across your entire stack. Additionally, Elastic stack can also collect various metrics from many different component (MySQL, Docker, Apache, see the full list here). This makes Elastic stack suitable for general-purpose monitoring.
MyArch is currently working on building the plugin for collecting metrics from DataPower, it will be available shortly.
DPBuddy’s Logstash plugins can be installed in an instant using “logstash-plugin install” command. The plugins do not require DPBuddy installation and can be used completely independently from DPBuddy. You can find detailed installation instructions here.
To simplify log management even further, DPBuddy 3.4 will come with a number of commands to automatically create syslog/XML/file log targets in DataPower as well as to easily update log levels and categories across multiple log targets/domains/gateways.
You can create a wide variety of queries and visualizations using Kibana to analyze your logs. Some examples are below. The pre-configured Kibana queries and visualizations can be downloaded from MyArch website and imported into Kibana.
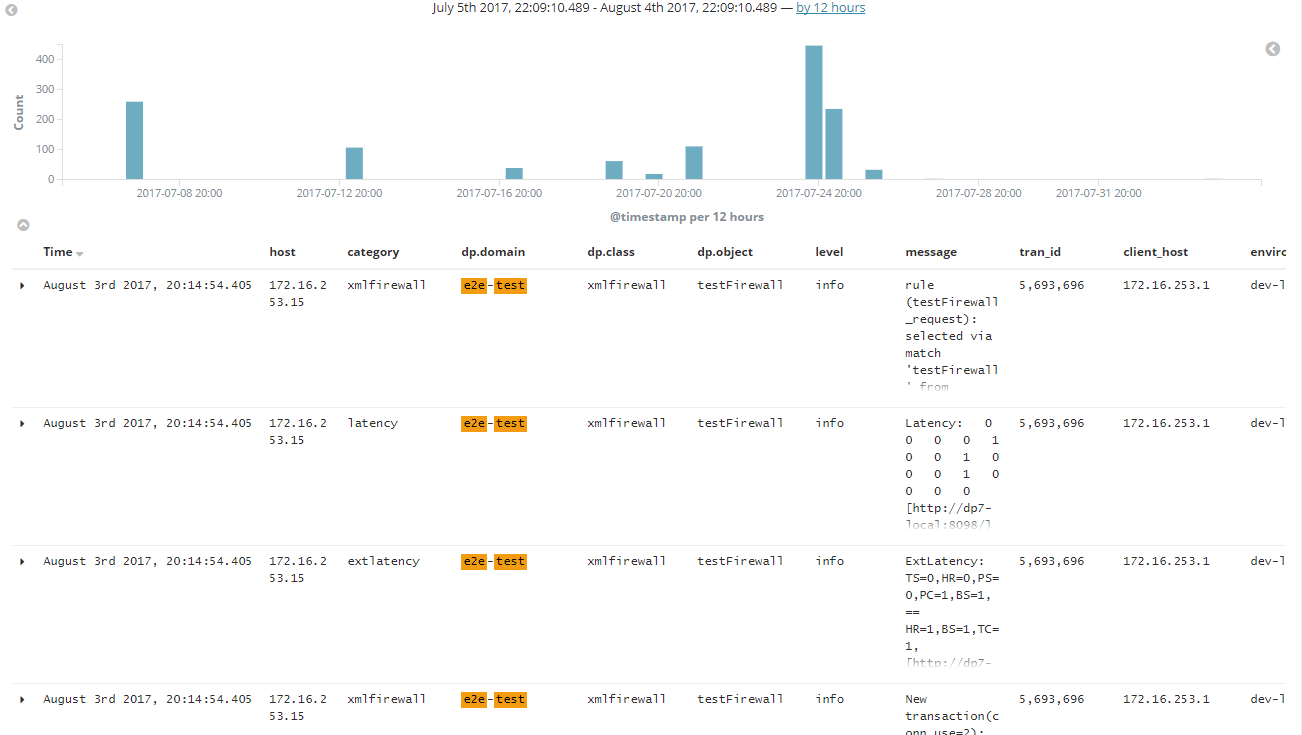
A typical DataPower search screen in Kibana can look like the following:
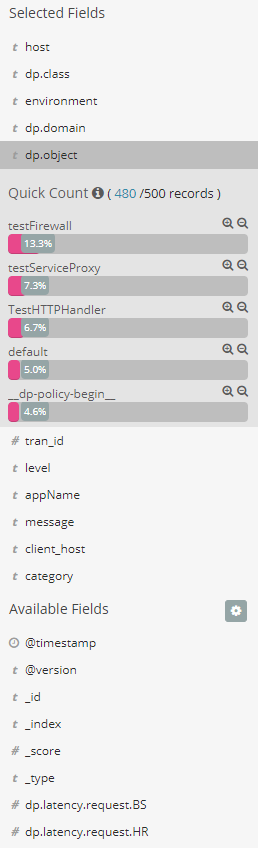
Kibana is extremely customizable, so you can easily rearrange/add/remove fields and also see the field statistics:
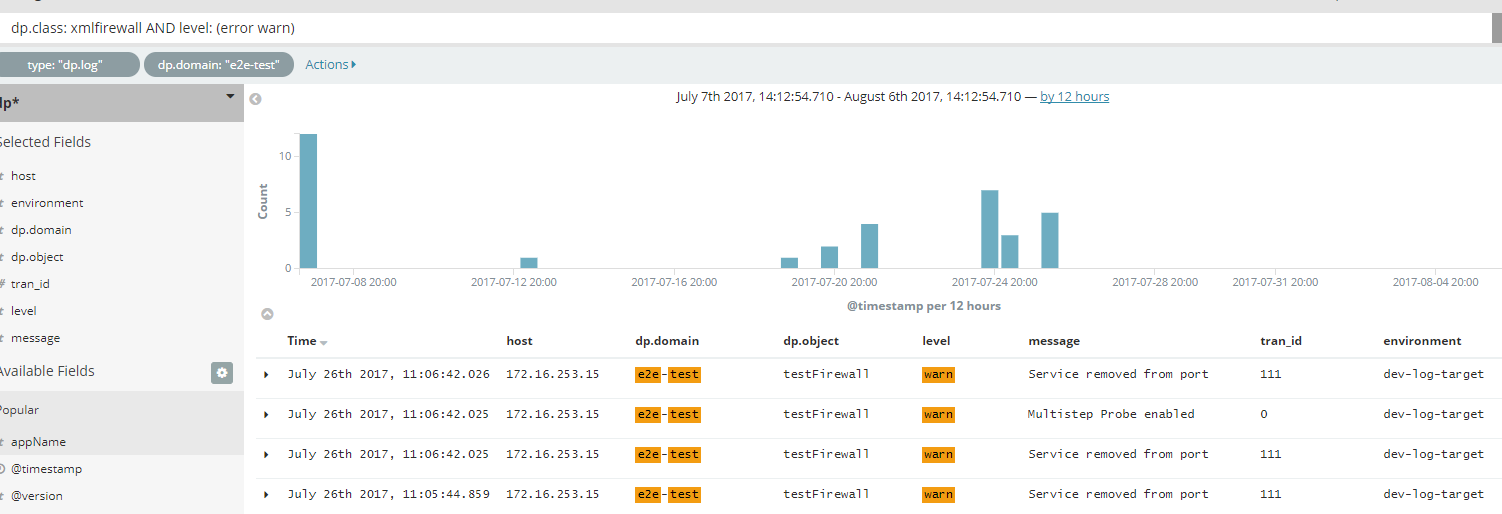
You can easily create searches based on various fields, e.g., this search only shows errors and warnings for all XML firewalls:
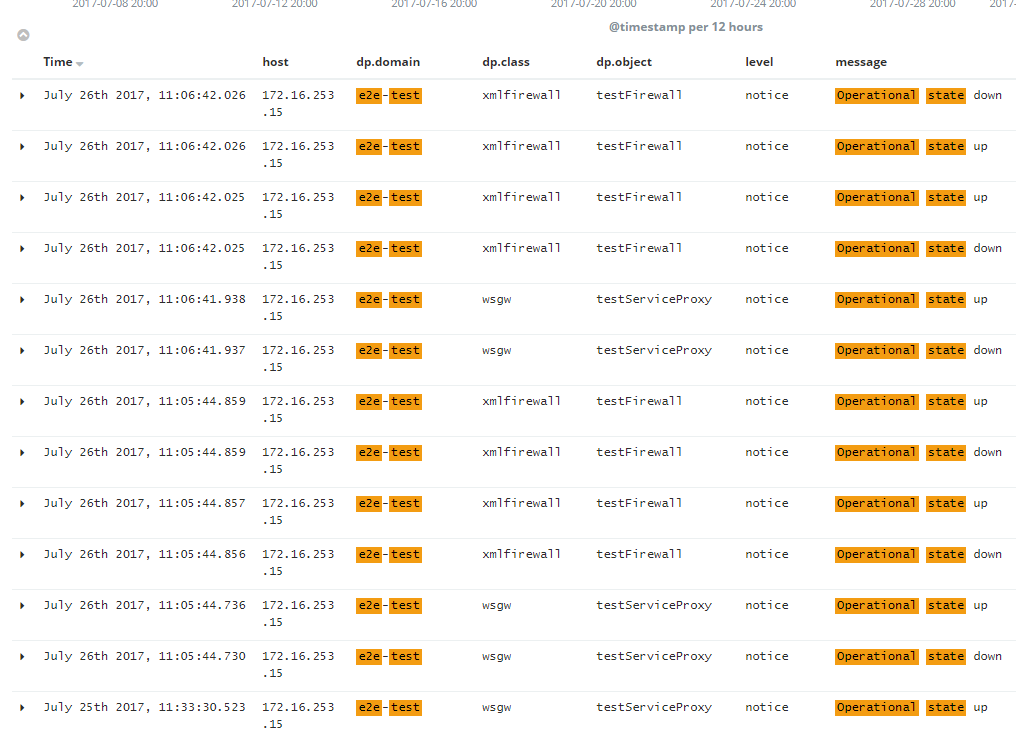
Or you track all changes to operational state:
DPBuddy’s audit log provides full visibility into the history of all changes, at an object or file level: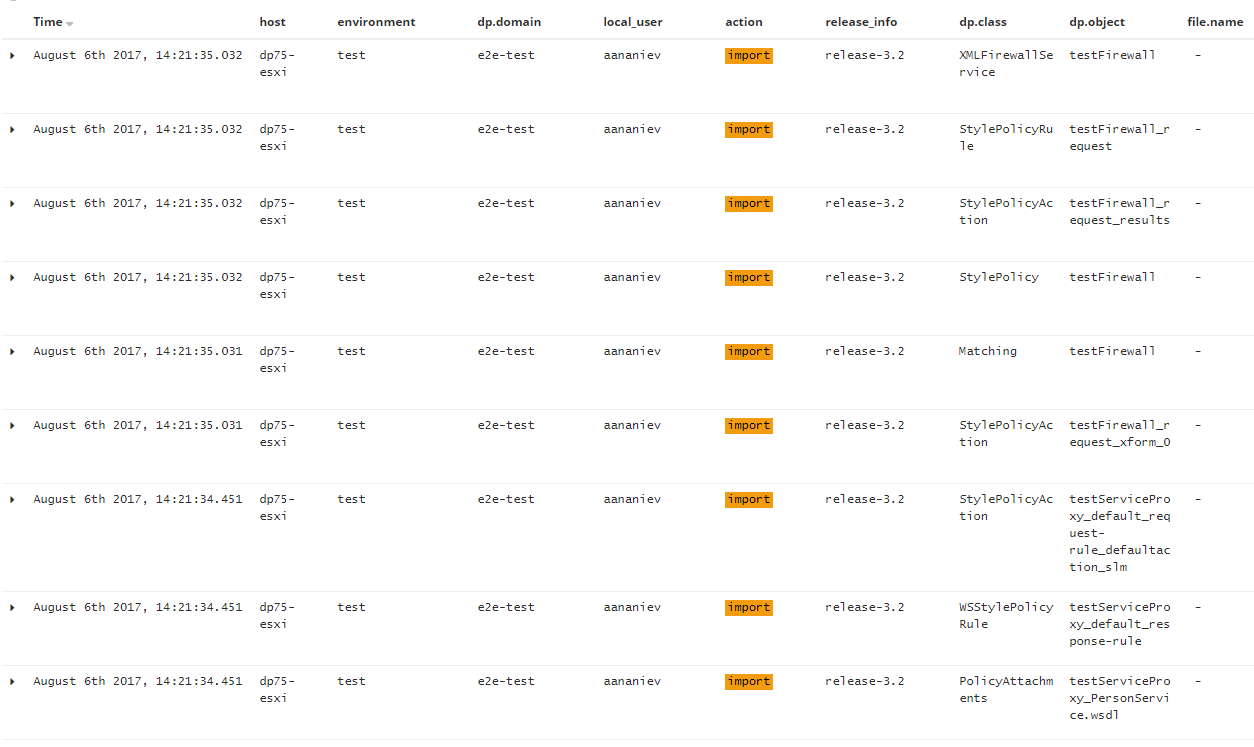
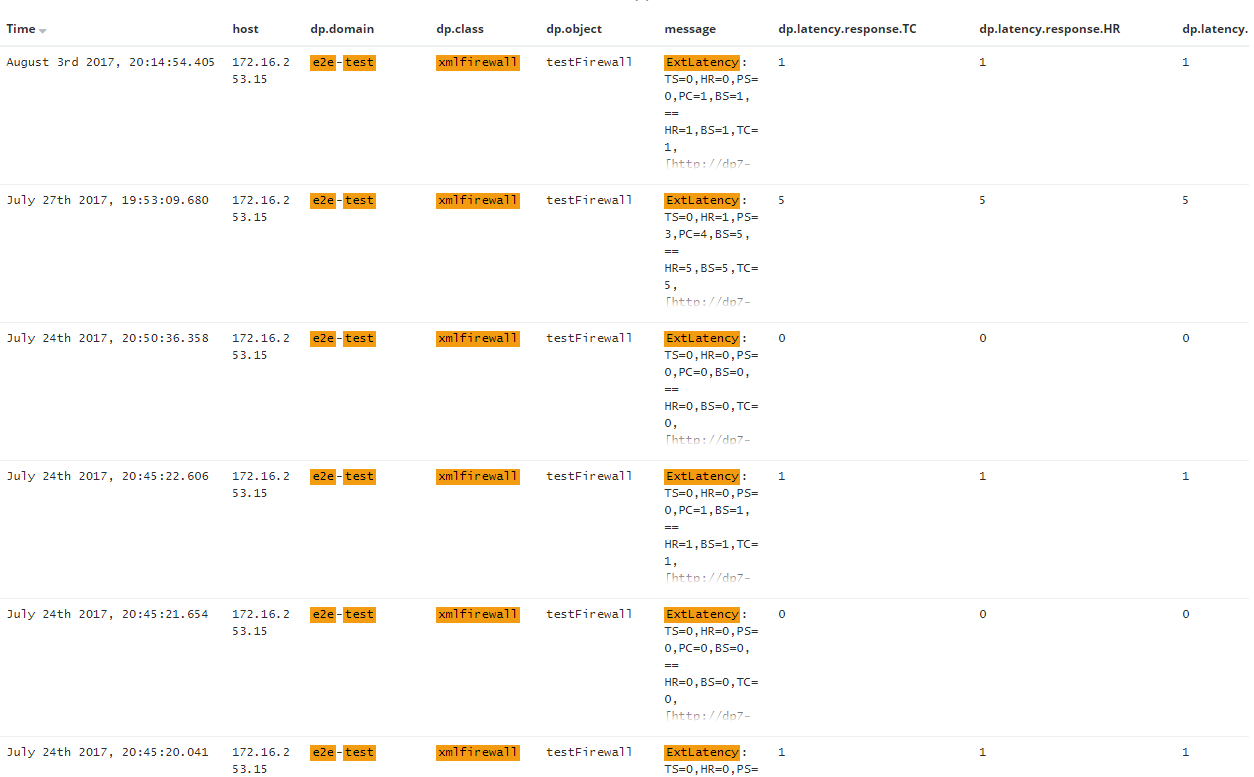
DPBuddy extracts latency information from the logs, so you analyze latency spikes or trends:
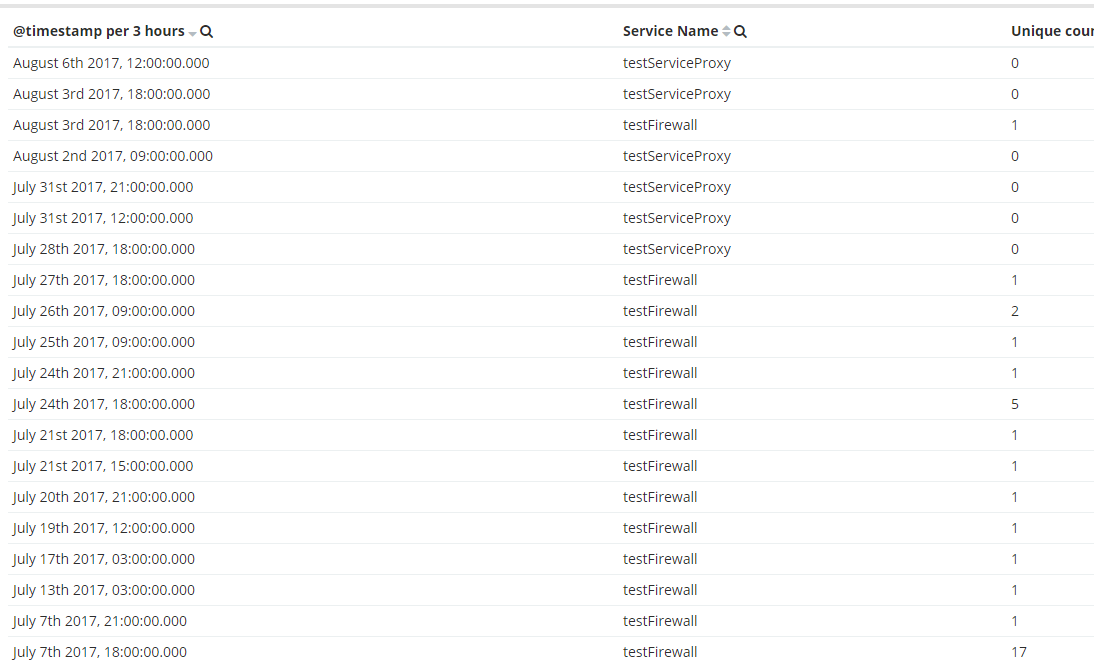
You can also build various aggregations and visualizations based on the information in the logs. For example, you can see your data volume based on the count of transaction IDs:
Once again, DPBuddy’s Logstash plugins do not require DPBuddy 3.4 installation, you can start using them today by simply running the appropriate “logstash-plugin install” command as described in our our documentation. We also provide consulting services to help you get started with Elastic stack and Logstash, please let us know if you’re interested.
If you’re interested in other new features of DPBuddy 3.4, such as log target management and firmware upgrades, please let us know as well.
Download DPBuddy to benefit from its numerous features and to completely automate your DataPower management, now with log collection.
Automate without scripting, monitor your services, check for compliance
Realize full potential of DataPower gateways